BLAZING FAST JS - Part I - (*as fast as possible)
Introduction
In today's article we will look over file manipulation and debugging of NodeJS applications using Chrome Dev Tools. I'll show you my attempts at using basic JS, how I analyzed the efficiency of my app and how I ended up making it BLAZINGLY FAST.
Context
I found myself in possession of a 5.3GB akamai 1.7 sensor file (S/O Arya).
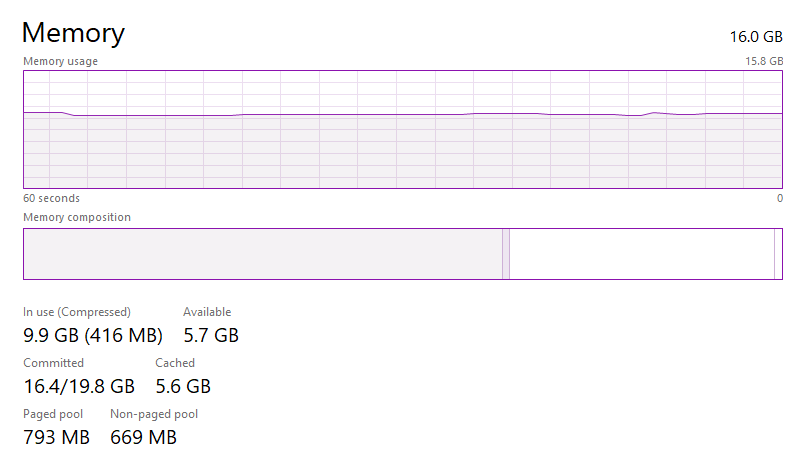
While my PC has 16GB of RAM, on idle it looks like 6.5/7GB are used, and trying to open the file in any kind of normal editor (klogg works fine, but I meant something like VSCode or Excel) goes crazy.
Not only that, but trying to open the whole file in NodeJS with the fs.readFileSync makes my brave crash. And I'd have NO problem whatsoever if it ate almost or even ALL my RAM, but it's slow, and after waiting for a long time, it just crashes, so it sucks. Now, you might wonder why Javascript/Typescript, that's because I love it and I'm most comfortable writing in (and I love debugging in it), and you might wonder why NodeJS, well cause Deno honestly sucks (missing some standard libraries that I usually use + Deno linter is SLOW AS ****).
Solution
So, for me to be (kinda) able to open the sensor data in Excel, I had to split it in multiple files. Also it's much easier for me to do the hard part now (splitting) and then just load each file into memory with python open() and then read(), than to just open the file, get the file descriptor and then read it in chunks and make sure I don't duck it up when I train the AI, sooooooo, yeah.
Alright, let's get to writing some code. The plan looks like this:
- open the file and get the file descriptor associated with it
- create a 1KB buffer
- read the header (we'll write it to the top of each file)
- create a 100MB buffer for data (In production we'll do 200MB buffer, for this first example NodeJS throws an error because of allocations)
- read data in chunks (at max 100MB) and make sure you update the file cursor position
- for each chunk, write it to a file
chunk${i}.csvfile inside thechunksfolder
// index.ts
import * as fs from "fs";
import * as path from "path";

const sensorFile = "sensor.csv";
const chunksFolder = "chunks";

const fd = fs.openSync(sensorFile, "r", 0o111);
const { size } = fs.statSync(sensorFile);

const B = 1;
const KB = B * 1024;
const MB = KB * 1024;

var buf = Buffer.alloc(100 * MB);

let header = "";
let position = 0;
// header
{
  let buffer = Buffer.alloc(KB);
  fs.readSync(fd, buffer, {
    length: buffer.length,
    position: position
  });
  header = buffer.toString("ascii").split(/\n/gm)[0];

  // add header.length + 1 for the newline that we've substracted
  position = header.length + 1;
  console.log(header);
}

let i = 0;
for (; i < 1 && i < Number.MAX_SAFE_INTEGER && position < size; i++) {
  console.time(`${i}`);
  fs.readSync(fd, buf, {
    length: buf.length,
    position: position
  });

  const stringifiedBuffer = buf.toString("ascii").split("");

  // we find the lastIndexOf n since we might have an incomplete line as the end of the chunk
  stringifiedBuffer.splice(stringifiedBuffer.lastIndexOf("\n"));

  // again, update position + 1 for newline
  position += stringifiedBuffer.length + 1;

  // save the header + newline + the stringifiedBuffer array to string
  fs.writeFileSync(path.join(__dirname, chunksFolder, `chunk${i}.csv`), header + "\n" + stringifiedBuffer.join(""));

  console.timeEnd(`${i}`);
  console.log(`CHUNK ${i + 1}`);
}
fs.closeSync(fd);
Our tsconfig.json looks like this:
{
  "compilerOptions": {
    "target": "ES5",
    "sourceMap": true,
    "module": "CommonJS"
  }
}
First, we'll compile with tsc and then run with node with the --inspect-brk flag, which enables the inspector agent and breaks before user code starts:
tsc -p tsconfig.json && node --inspect-brk=localhost:9229 index.js
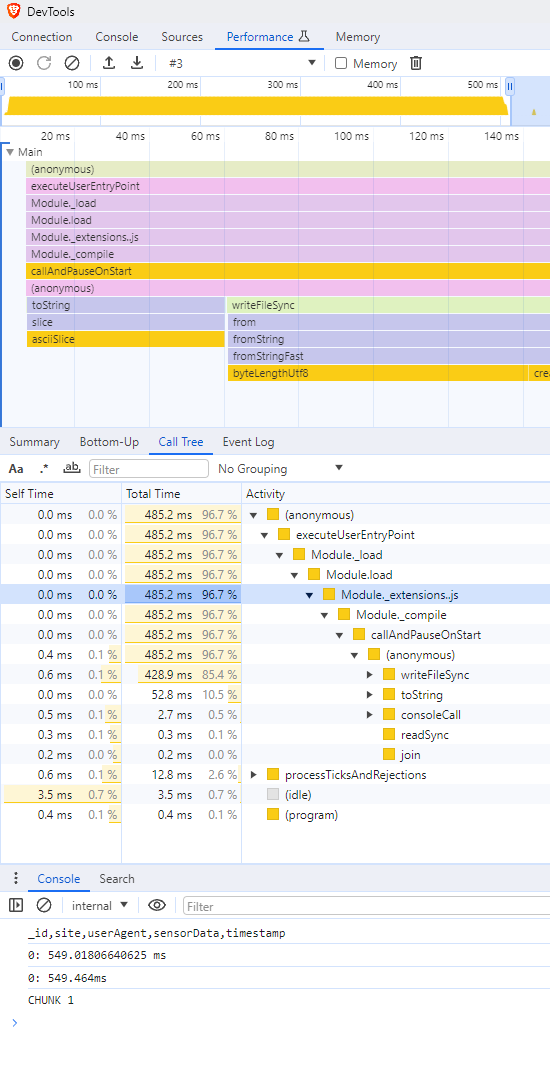
Next we navigate to chrome://inspect, go to the performance tab and profile the code.
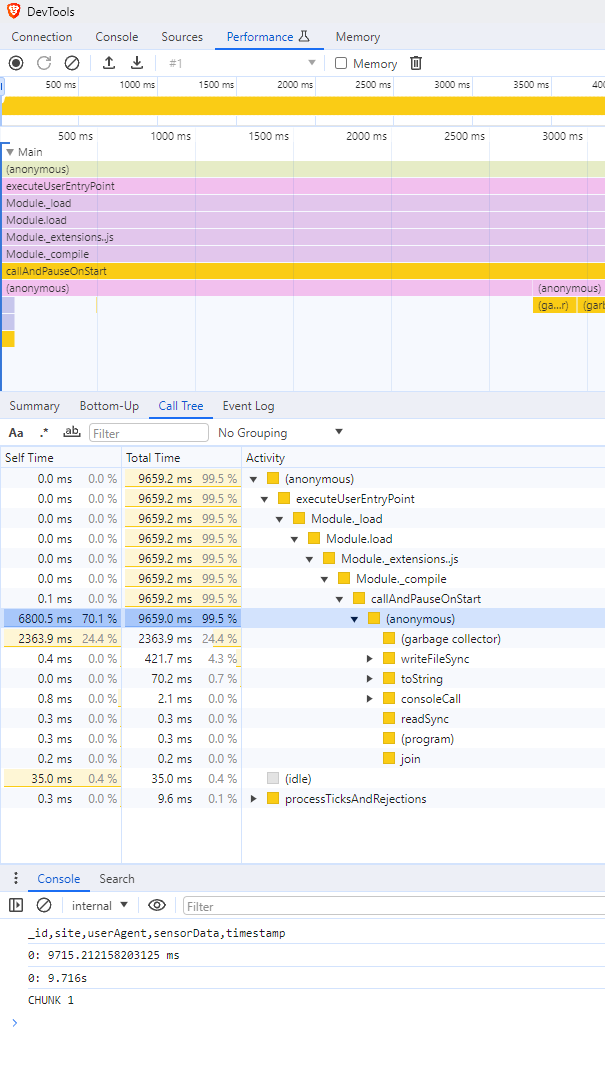
Also the console says something like this (almost 10 seconds!!!):
_id,site,userAgent,sensorData,timestamp
0: 9.716s
CHUNK 1
From this Call Tree we can see that most of the time is spent inside an anonymous function inside the (callAndPauseOnStart)[https://github.com/nodejs/node/blob/main/src/inspector_js_api.cc#L182] function, which is basically the function that we break on before user code starts. But inside it we can actually see the first big culprits: The GC, which the profiler tells us takes around 25% of the time of the whole script and writeFileSync, which writes the file to disk. The top level chart also agrees with what the Call Tree tells us. Those big orange bars that say (garbage collector), well, you've guessed it, it's the GC!
But why, let's think about WHY for a second. Why is it that the GC takes that much time? Well, the GC clears the unused memory, and we have unused memory when it goes out of scope/when it's not used anymore, which honestly happens when we do a lot of allocations, or a small amount of HUGE allocations. So where are we allocating? Let's go to the Sources tab and see the hotspots.
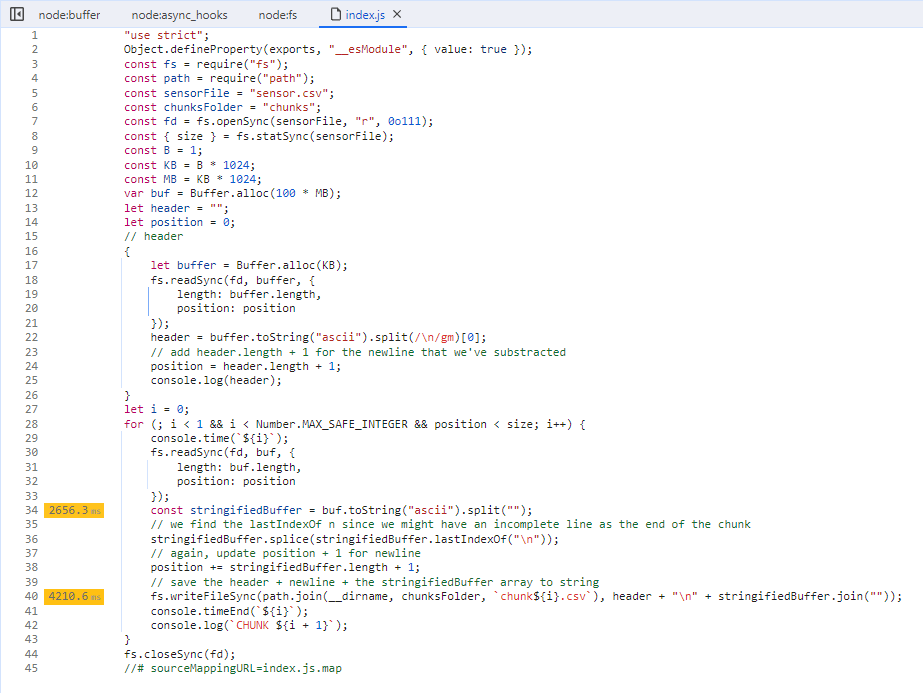
As we can see, the most time is spent when converting the buffer to an ascii string, and then splitting it. Almost DOUBLE the time is spent when writing it to disk, let's do a few modifications to get better insights:
import * as fs from "fs";
import * as path from "path";

const sensorFile = "sensor.csv";
const chunksFolder = "chunks";

const fd = fs.openSync(sensorFile, "r", 0o111);
const { size } = fs.statSync(sensorFile);

const B = 1;
const KB = B * 1024;
const MB = KB * 1024;

var buf = Buffer.alloc(100 * MB);

let header = "";
let position = 0;
// header
{
  let buffer = Buffer.alloc(KB);
  fs.readSync(fd, buffer, {
    length: buffer.length,
    position: position
  });
  header = buffer.toString("ascii").split(/\n/gm)[0];

  // add header.length + 1 for the newline that we've substracted
  position = header.length + 1;
  console.log(header);
}

let i = 0;
for (; i < 1 && i < Number.MAX_SAFE_INTEGER && position < size; i++) {
  console.time(`${i}`);
  fs.readSync(fd, buf, {
    length: buf.length,
    position: position
  });

  const _stringifiedBuffer = buf.toString("ascii");
  const stringifiedBuffer = _stringifiedBuffer.split("");

  // we find the lastIndexOf n since we might have an incomplete line as the end of the chunk
  stringifiedBuffer.splice(stringifiedBuffer.lastIndexOf("\n"));

  // again, update position + 1 for newline
  position += stringifiedBuffer.length + 1;

  // save the header + newline + the stringifiedBuffer array to string
  const joined = stringifiedBuffer.join("");
  fs.writeFileSync(path.join(__dirname, chunksFolder, `chunk${i}.csv`), header + "\n" + joined);

  console.timeEnd(`${i}`);
  console.log(`CHUNK ${i + 1}`);
}
fs.closeSync(fd);
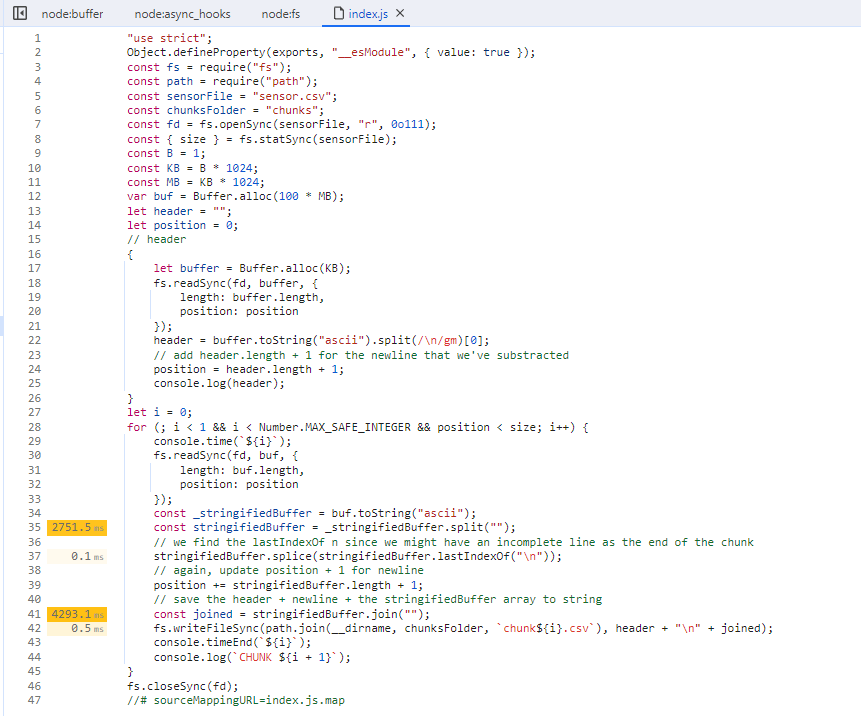
Aha! So actually writeFileSync wasn't the problem. And even if it was, we have no control over that, we still need to write data to disk, we'd need to dig into C++, modify the source code of V8 (or NodeJS, since I have no clue if V8 supports by default writing to disk) and then compiling. Or create a NodeJS Addon with NAPI in C++ or Rust that would deal with that, but we don't go there for this article.
The problem arises when we convert the ascii string to an array (split("")) and then when we transform it back to a string (join("")) again.
If I'm being 100% honest with you, I have no clue why, and no, I'm not gonna dig inside to see what's going on (I will in the future probably). But what we can conclude is that Buffers and Strings seem to be faster than Arrays. Moreso than that, the .split("") method created a copy of the string which gets transformed into an array, which means we DOUBLE the memory usage (at least)
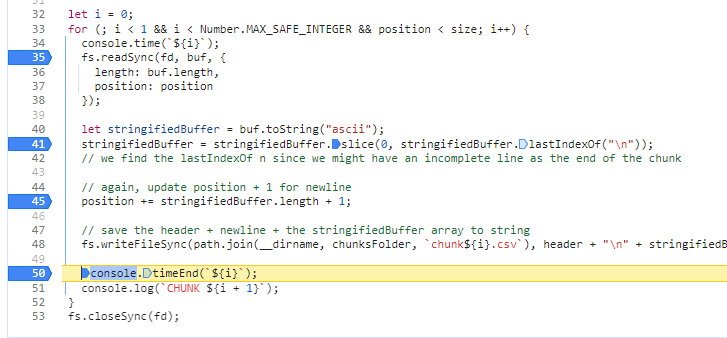
But why was I using an array? Why was I converting? Well, it was because arrays are really easy to use, and at the end of the chunk, there might be a \r character, which would kinda duck up the csv file and made it so it looked like a new line was there (Windows would prolly add it, I'm not 100% sure, but when opening the .csv file in something like VSCode I could see the new line). Could there be a better way to go about this? Let's try using String.prototype.slice(), even though that ALSO duplicates the string, which means memory usage:
import * as fs from "fs";
import * as path from "path";

const sensorFile = "sensor.csv";
const chunksFolder = "chunks";

const fd = fs.openSync(sensorFile, "r", 0o111);
const { size } = fs.statSync(sensorFile);

const B = 1;
const KB = B * 1024;
const MB = KB * 1024;

var buf = Buffer.alloc(100 * MB);

let header = "";
let position = 0;
// header
{
  let buffer = Buffer.alloc(KB);
  fs.readSync(fd, buffer, {
    length: buffer.length,
    position: position
  });
  header = buffer.toString("ascii").split(/\n/gm)[0];

  // add header.length + 1 for the newline that we've substracted
  position = header.length + 1;
  console.log(header);
}

let i = 0;
for (; i < 1 && i < Number.MAX_SAFE_INTEGER && position < size; i++) {
  console.time(`${i}`);
  fs.readSync(fd, buf, {
    length: buf.length,
    position: position
  });

  let stringifiedBuffer = buf.toString("ascii");
  stringifiedBuffer = stringifiedBuffer.slice(0, stringifiedBuffer.lastIndexOf("\n"));
  // we find the lastIndexOf n since we might have an incomplete line as the end of the chunk

  // again, update position + 1 for newline
  position += stringifiedBuffer.length + 1;

  // save the header + newline + the stringifiedBuffer array to string
  fs.writeFileSync(path.join(__dirname, chunksFolder, `chunk${i}.csv`), header + "\n" + stringifiedBuffer);

  console.timeEnd(`${i}`);
  console.log(`CHUNK ${i + 1}`);
}
fs.closeSync(fd);
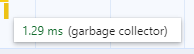
Well would you look at that, from 10 seconds to .5 seconds, a 20x speed increase Not only that, but I can't even see the GC anymore! Well nvm, it's there but, less than 1.5ms.
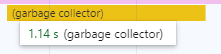
While in the previous run the GC took up to 1 second! (on only one of its runs)
We need to also take into consideration the GC, and anything else that runs in the current thread that we are looking at and not in another worker. I'm reminding you, Javascript is SINGLE THREADED and there is crazy cool thing called the Event Loop that's like the OS that decides who can execute at a given time, so if the GC takes a lot of time, that's time in which your code can NOT execute, and I HATE when I gotta wait.
Okay, now we made efficient, let's also take a look at the memory consumption! We'll do the next things:
- Rerun the script
- Add some debugger points to take Heap Snapshots and understand allocations
The final result looks like this:
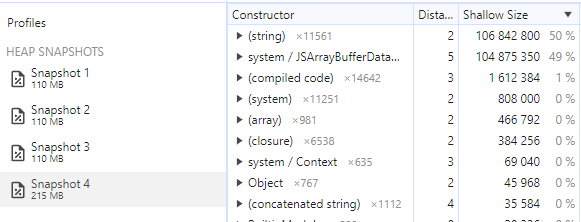
What we can conclude is that there's only one big allocation that happens after we allocate the initial buffer of 100MB, an allocation that happens between Snapshot 3 and Snapshot 4, let's tell Dev Tools to only show us those!
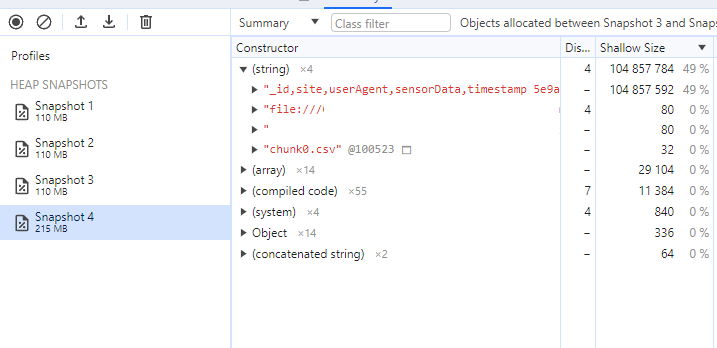
Aha! The header + "\n" + stringifiedBuffer expression gets evaluated to a new string which is placed in memory and the GC doesn't instantly collect it!
But wait a second, How come have we allocated 100MB for the initial Buffer, and now that this string is in memory, we have only 200MB (or around 200MB) of memory allocated on the heap, but we also have a reference to stringifiedBuffer which should be a string, right? In memory?
Well, I guess (Still not sure!) I think we found out why string is faster than a char array (string array, but the strings are 1 char long), or at least in our case, where we transform a buffer to a string. There isn't actually ANY STRING on the heap, so basically, our string is more like a String View in C++. The underlying Buffer is what is stored in memory, and the string acts just like a reference!... Until we concatenate it! Even the String.prototype.slice method that should return a new string, looks like it's returning a String View.
Getting back to the concatenation of the stringifiedBuffer, if we had more big allocations in that loop and wanted to clear memory on the sport, we could have nested BlockStatements, or just expose the gc with the --expose-gc flag and just call global.gc() when we want to let the GC clear stuff.
End
Till next time!